SD WAN performance issues like packet loss and latency caused by dynamic traffic routing are common, but many network operations teams have difficulty monitoring SD WAN performance. SD WAN optimization starts with in-depth SD WAN performance monitoring that sees network performance across SD WAN overlay and underlay (private and public) networks. Employees accessing internal, SaaS and web applications are often impacted by latency and packet loss issues originating from the SD WAN. From this perspective SD WAN performance monitoring is more actionable when set in the context of the user experience. This allows NetOps teams to focus SD WAN performance troubleshooting and optimization efforts where they can deliver the greatest gain in business performance.
The purpose of SD performance monitoring is to ensure that services are delivered to users with the right availability and response times — the best user experience for the most productive business. In an architecture based on SD WAN, what is the best possible way to monitor connectivity?
SD WAN Monitoring and Overlay Metrics
Most SD WAN solutions measure latency and packet loss from SD WAN appliance to appliance at the overlay level. The latency and loss in the network overlay level will be influenced by events like switching from one underlay connection to another, a change in the underlay path(s), or underlay congestion or degradation. You can learn all about how SD WANs work, and what causes performance issues in this post.
Overlay metrics indicate when there is a general performance issue across the SD WAN – for example, latency, loss, or jitter – but cannot provide an explanation into the reason why.
Correlate SD WAN underlay and overlay performance
The SD WAN configuration manages the overlay fabric and traffic routing between deployed SD WAN appliances without detailed visibility into underlay infrastructure. For example, if Microsoft Teams traffic is directed into a particular network underlay (e.g. a local ISP), it may then traverse multiple autonomous systems (AS) / internet providers before arriving at the far-end SD WAN appliance. BGP routing and redirections are controlled by the various AS along the underlay, not by the SD WAN solution. A change in path can have significant implications on latency, but without knowing how a path changed happened, or how to avoid it, SD WAN configuration can’t be optimized to ensure consistent performance
To optimize SD WAN performance you need to complement the basic metrics available from SD WAN solutions with end-to-end performance monitoring at both the overlay and underlay levels:
- Monitor multiple overlays configured to use different underlay connections (say using operator 1 or operator 2). This will reveal which underlay connection delivers the best quality of service, as well as its stability and performance over time.
- Monitor the underlays to validate their status and performance (number of hops on the path, change in routing and latency, signs of congestion on routers and security gateways).
This means that to understand, troubleshoot and optimize SD WAN overlay performance you need to understand:
- which underlay is used
- how each underlay is performing

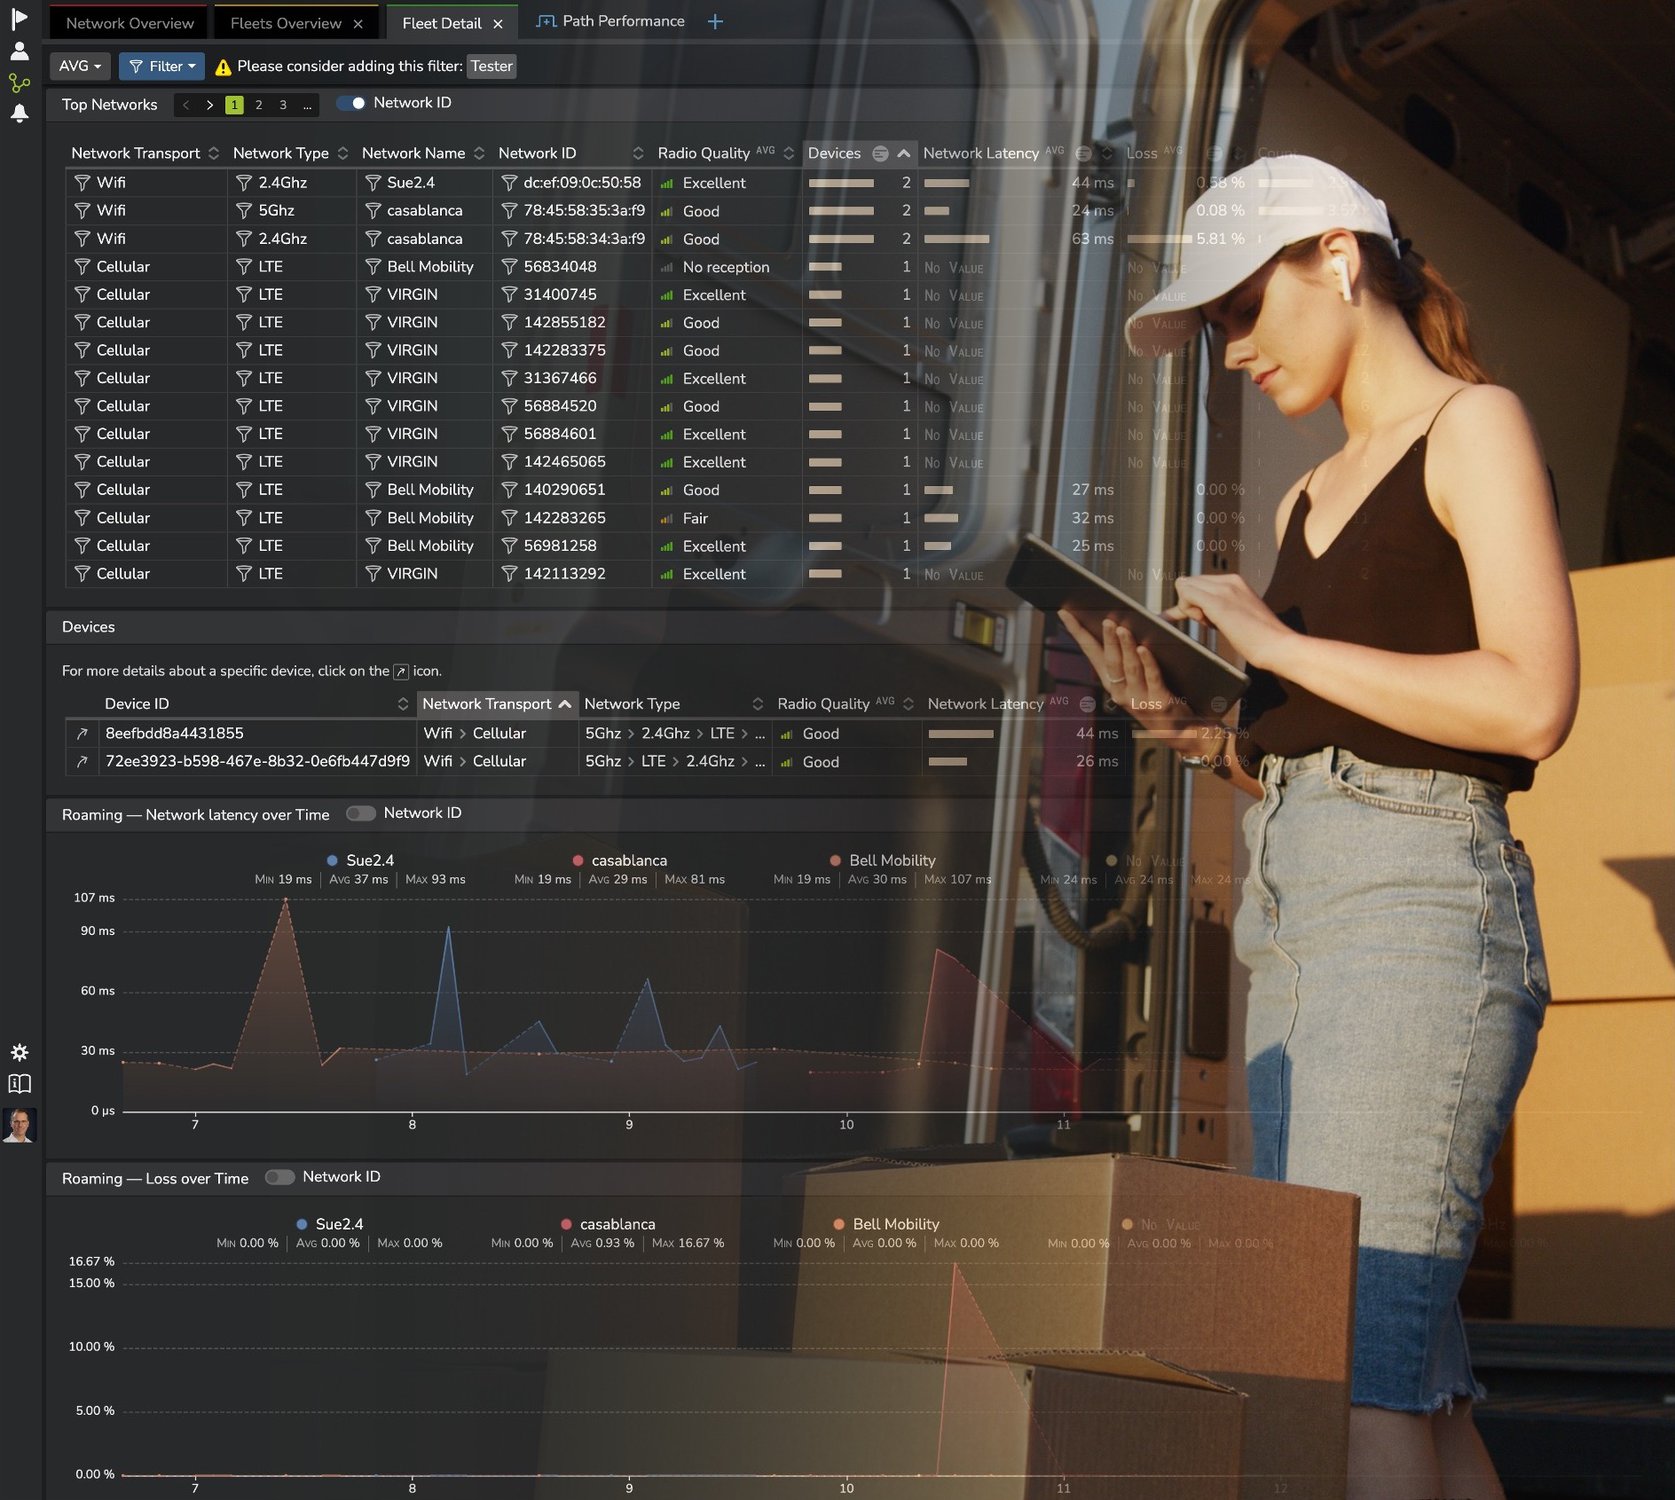
Understand the User Experience

IT help desks often get complaints from employees that applications aren’t performing well without having much insight on where they originate. While the SD WAN or network may be the origin, there are many other sources of latency, loss and unstable performance from the end-user perspective. For example:
- Device / laptop performance issues (time to reboot?)
- Browser configuration and caching
- Access / WiFi network performance
- Server or SaaS application response time
- 3rd party services impacting application performance
In order to quickly isolate whether performance problems originate within the SD WAN it is essnteial to be able to correlate network performance with user experience without having to consult multiple dashboards and tools. This helps IT teams focus on the real problem domain faster, and accelerates resolution time for all kinds of performance issues, wherever they originate.
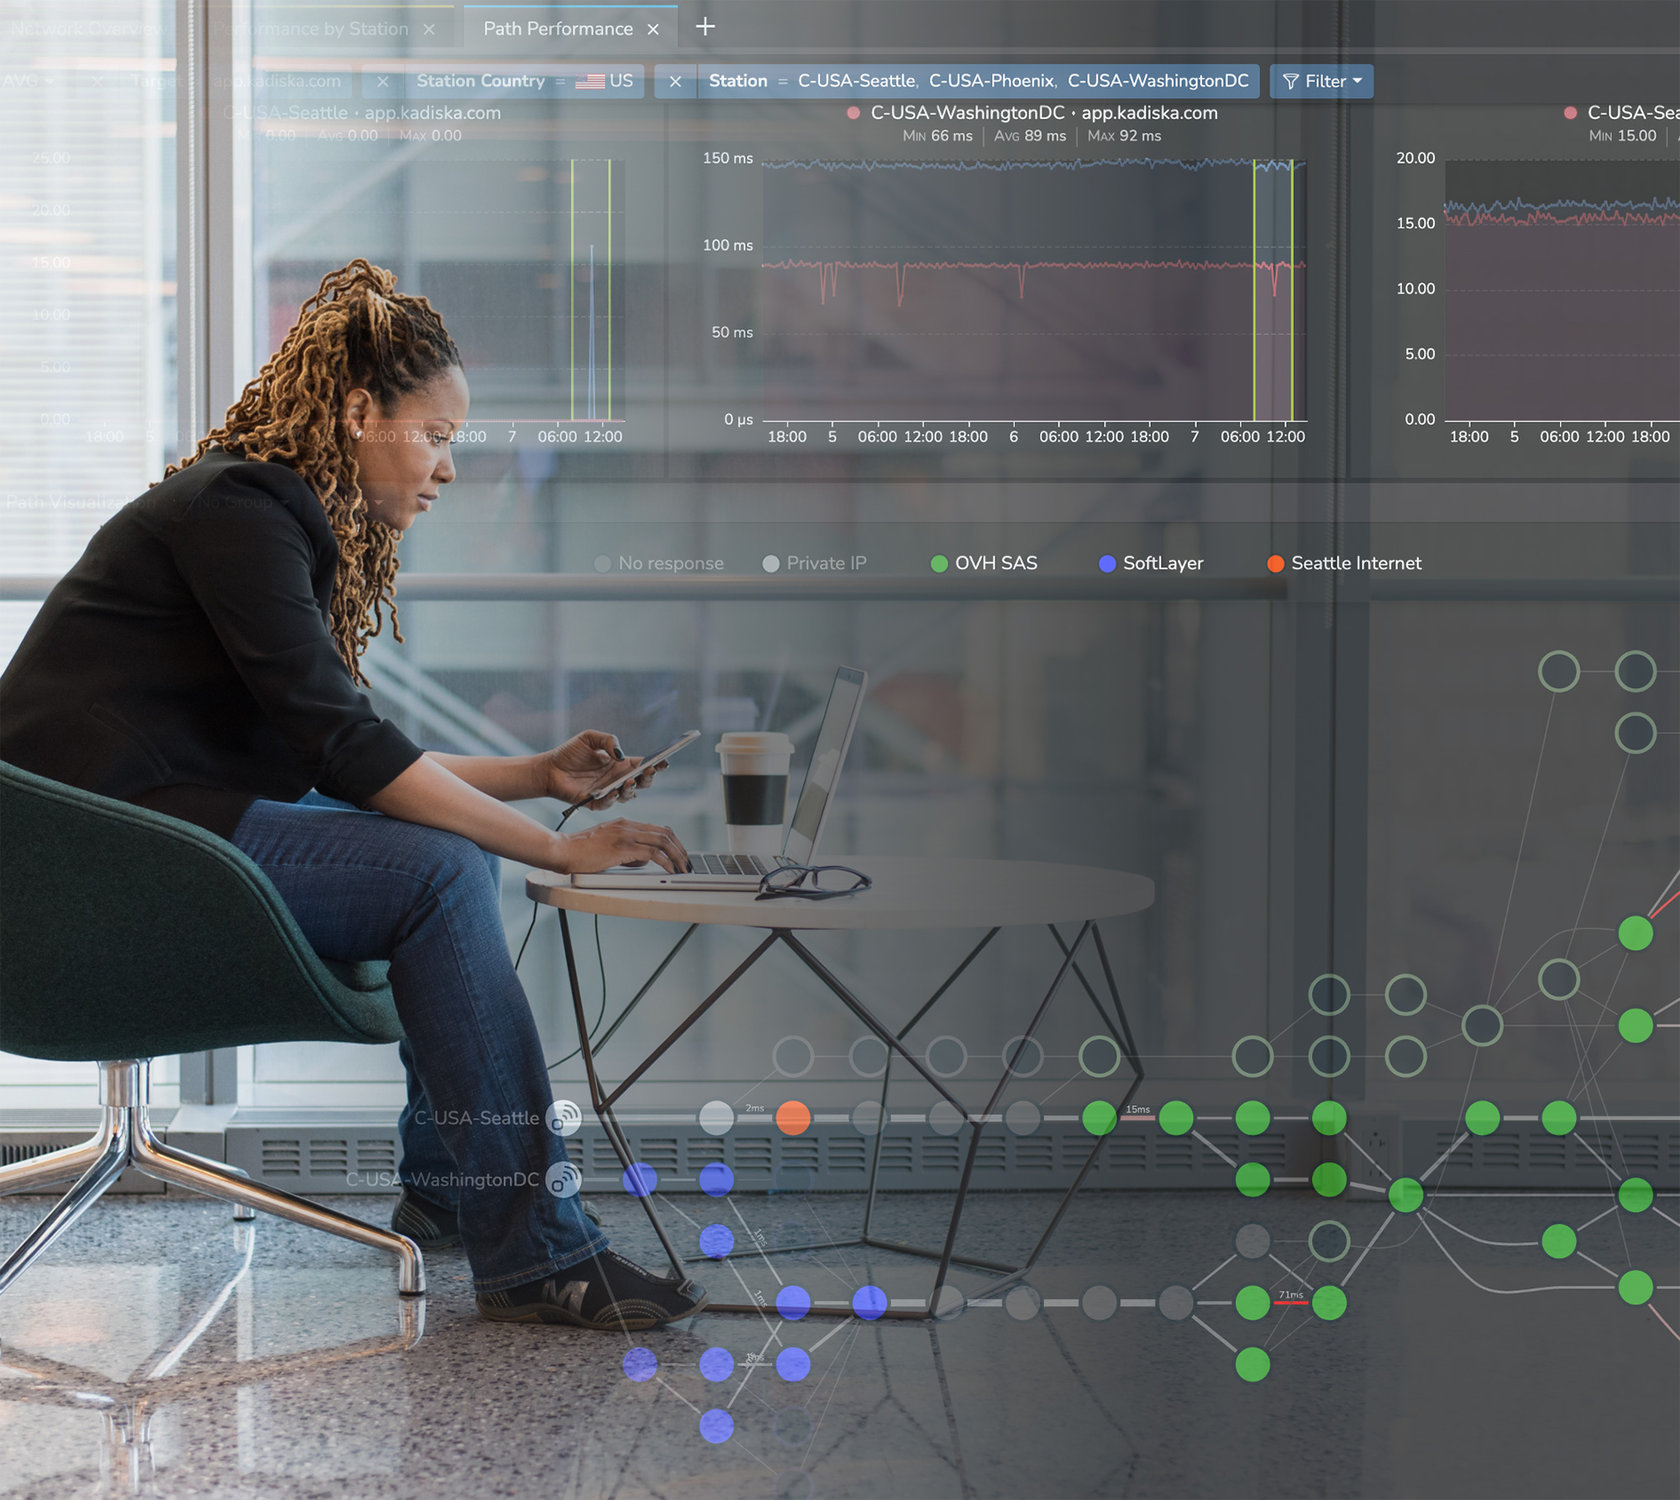
Extend from SD WAN monitoring to end to end connectivity monitoring
To cover the end-to-end user to application path it is essential to measure connectivity for the whole path:
- WiFi / LAN
- Access network performance from user to SD WAN (e.g. ISP, VPN)
- Overlay performance and user experience for each key route and application
- Performance on each of the underlays (# hops, latency, jitter, loss and detailed routes)
- Security gateway (measure their impact on overall latency and loss) – onsite (SGW) or cloud (SASE/CASB)
- Connectivity between SD WAN handoff to the cloud
- Cloud networks

Monitoring SD WAN is essential to optimizing performance and getting the best return on investment. We’ve seen that SD WAN solutions’ metrics are not enough to efficiently identify performance issues and where they originate. In-depth network tracing and performance analysis combined with the end-user perspective offers a best-in-class approach to managing and maintaining a high performance SD WAN infrastructure.
Learn how you can gain 100% insight into your SD WAN and application infrastructure with our unique, modern approach to digital experience and network performance monitoring.